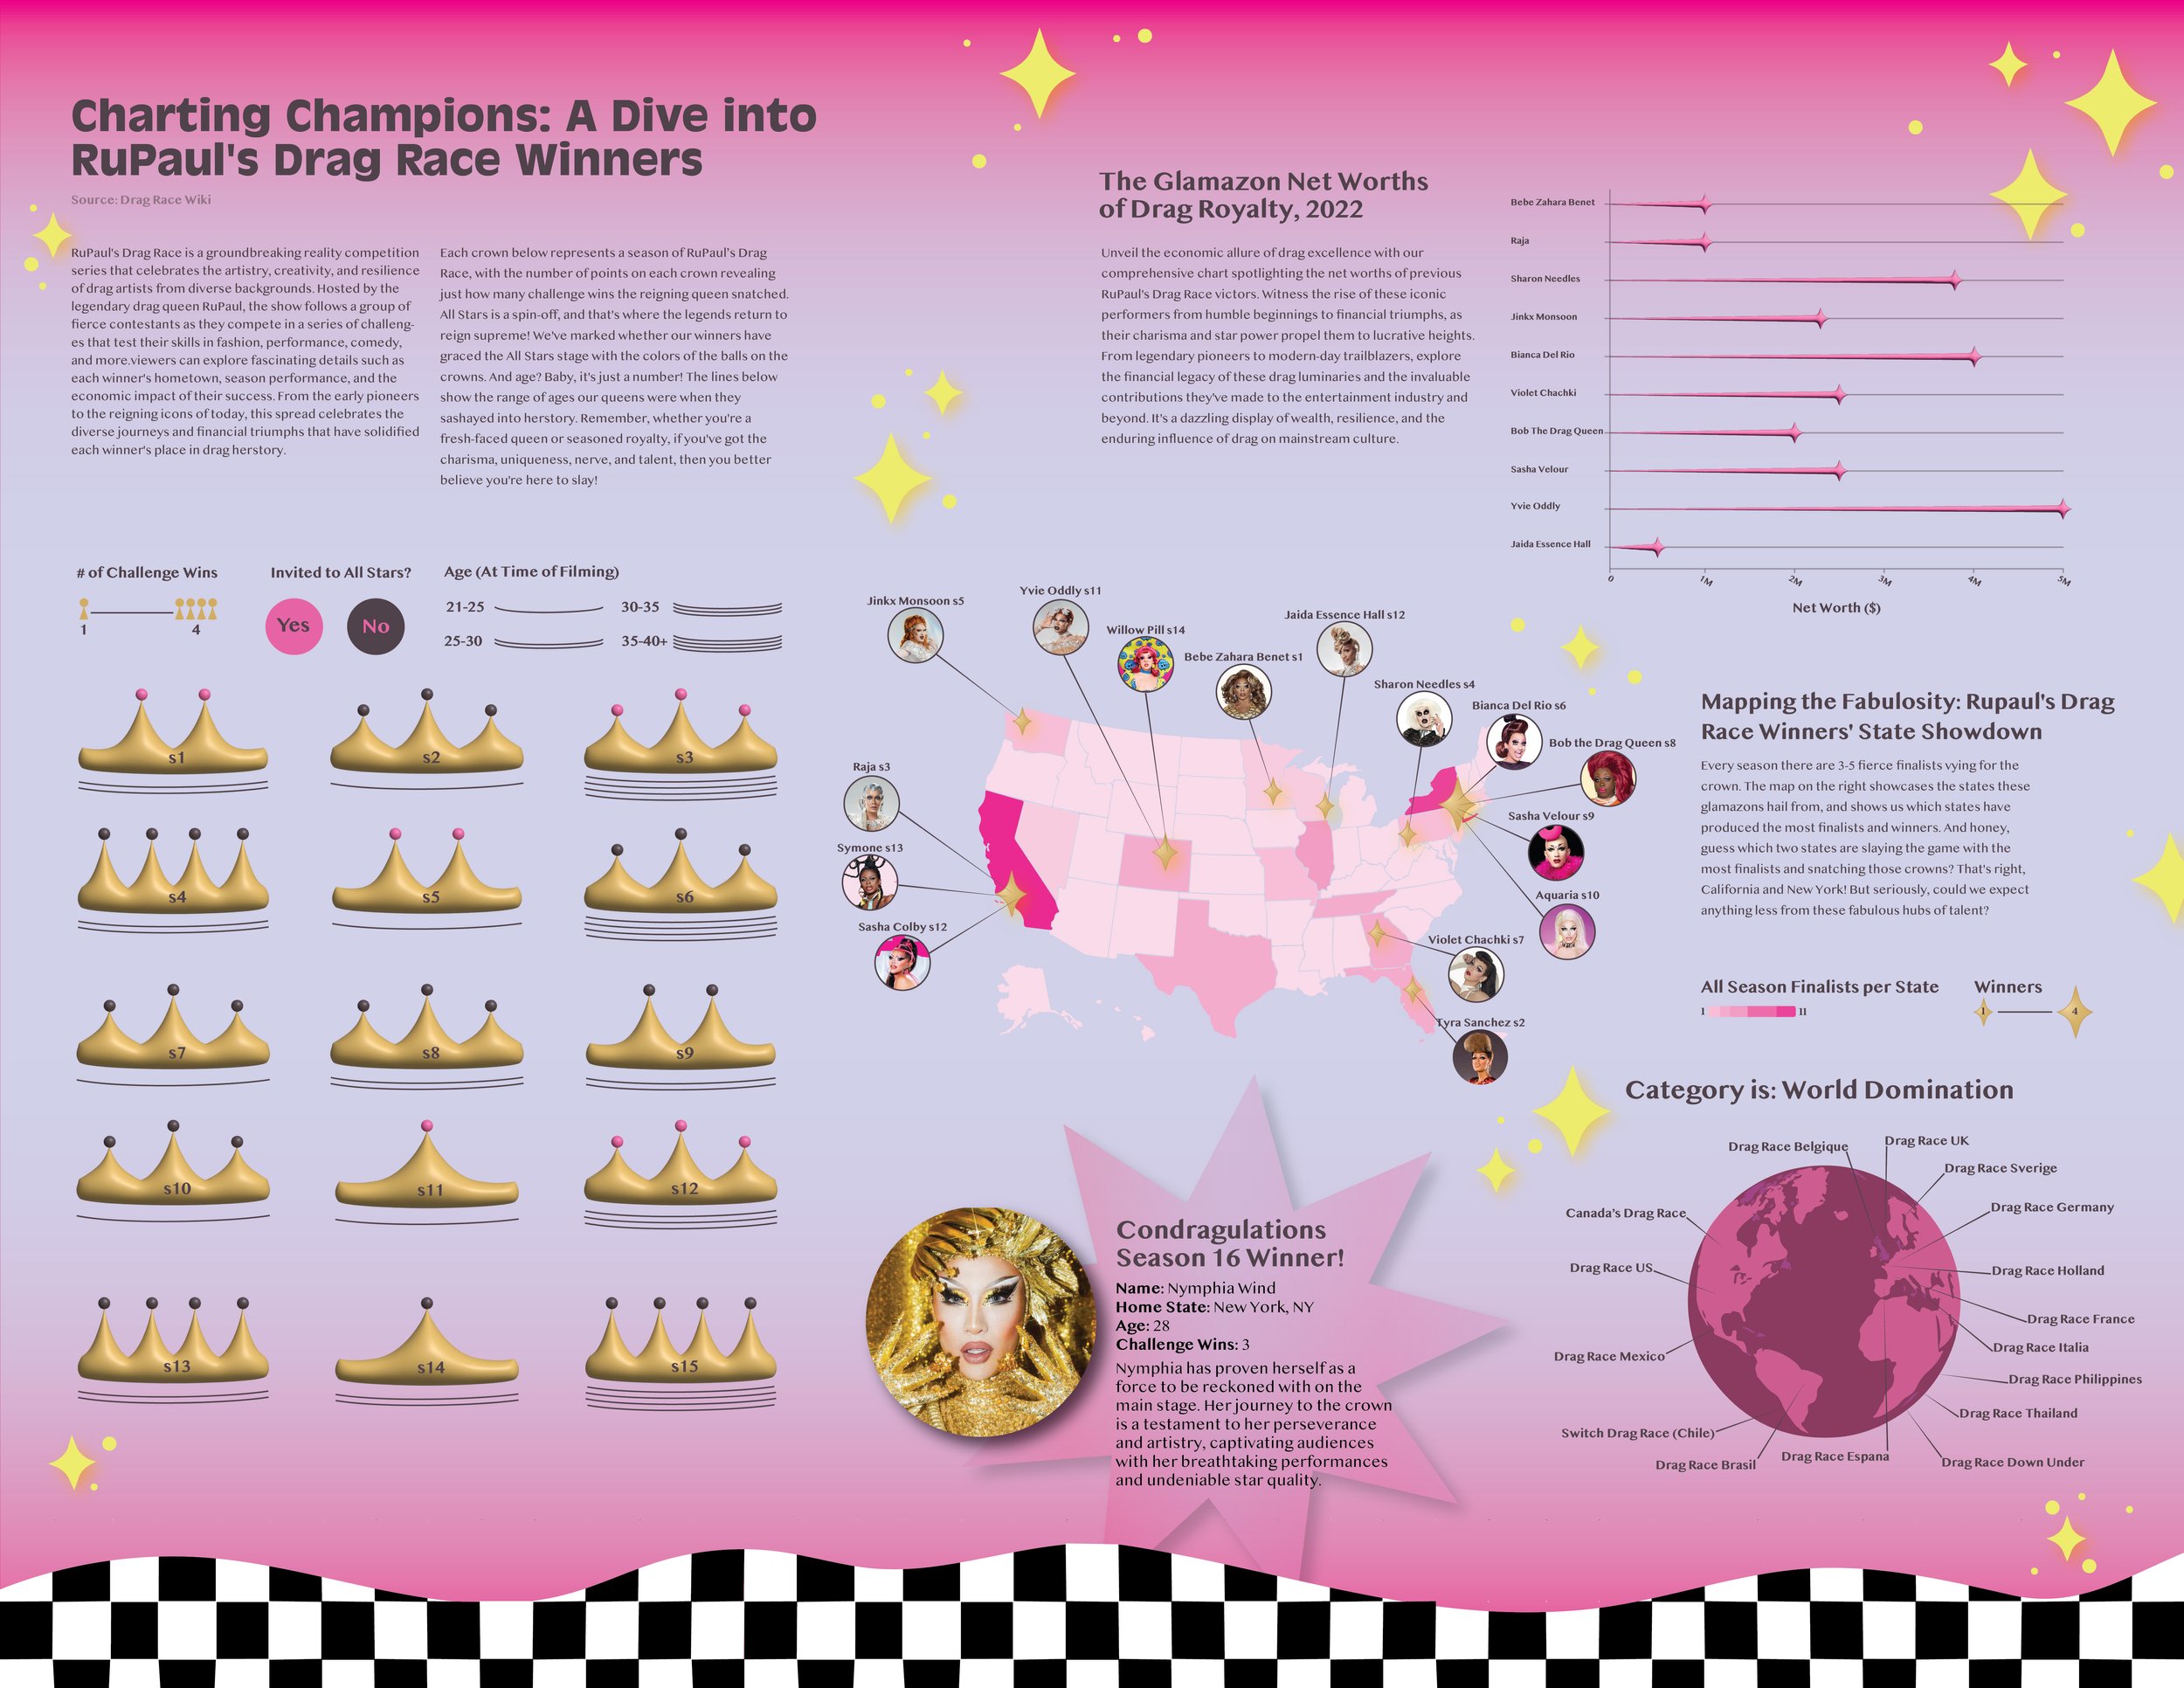
This data visualization explores the winning history, achievements, and economic impact of contestants from RuPaul's Drag Race, one of the most influential and globally celebrated drag competition shows. The project blends storytelling and analytics to highlight key insights into the franchise's champions, their performance metrics, and their post-show success.
An intuitive crown chart visualizes the winners' challenge victories across seasons, alongside their ages during filming and whether they were invited to compete in All Stars. This section reveals patterns in competitive performance, showcasing standout queens who dominated their seasons. The visualization also includes an economic analysis of drag royalty, featuring a sleek graph of net worths that underscores the post-show success of winners through brand deals, music careers, and entrepreneurial ventures.
A geographic breakdown maps each winner's home state across the U.S., identifying where the most finalists and champions originate while offering insights into regional contributions to drag excellence. Expanding the scope further, a world map highlights the global influence of the franchise, illustrating its international expansions and emphasizing its impact on drag culture worldwide. The visualization concludes with a spotlight on the most recent champion, celebrating their journey to the crown and their growing influence in the industry.
This project combines clean design and dynamic visuals to tell a story of success, artistry, and resilience, offering viewers a deeper understanding of the cultural and economic legacy created by RuPaul's Drag Race and its champions.
Data was collected from various sources including season recaps, fan databases, and public records.

![AdobeStock_137331281 [Converted].png](https://images.squarespace-cdn.com/content/v1/671454c0ce946b5929b9e11f/3cd17101-7566-4040-8b50-6f066a4b7352/AdobeStock_137331281+%5BConverted%5D.png)